Going Beyond Traditional Spend Analytics to Identify Risks and Drive Change

PayPal co-founder Max Levchin once said, “The world is now awash in data and we can see consumers in dramatically clearer ways.” What Max did not mention is that thanks to all this data, companies can now see their suppliers in much clearer ways, too. This begs the question, is your procurement department making the most of all your data?
For twenty years we’ve been collecting, cleansing, and classifying spend data to produce the traditional “spend cube” as illustrated below. This has all been done in an effort to answer some pretty basic questions, such as:
- What are we buying?
- Who are we buying from?
- How much did we pay? How much did we save?
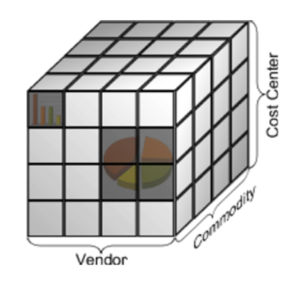
Figure 1: Traditional spend analytics develops insights in three dimensions (Vendor, Commodity and Cost Center). Source: spend analysis – Wikipedia
However, to demonstrate to C-level executives that your efforts can have an impact on the bottom line and align to the company strategy, you must add Company Objectives as the fourth dimension of your spend analysis.
Incorporating additional information into your analyses
Ultimately, what we want is not just to have that “aha” moment when we draw insights from the data. We want to drive the purchasing changes that will ensure that our procurement operation is in alignment with our business goals—including our sustainability and diversity goals—and that we are choosing to build relationships with suppliers that minimize our risks.
As a supplier relationship management platform, LUPR has additional information about suppliers that can be brought into the picture. While your spend data tells you exactly what you’ve spent with who and on what, LUPR has data on other factors, such as:
Performance – How well are suppliers performing relative to Key Performance Indicators (KPIs)? How quickly do they respond to quality issues?
Sustainability – Do suppliers have proper governance? Are they employing children, either themselves or at sub-suppliers? Are they damaging the environment? Are they taking steps to minimize their carbon footprint? And much more.
Diversity – Is the company women-owned or minority-owned? How diverse is their management, board, and labor force as compared to the geographic area in which they operate? What are their opportunities to improve?
Financial Risk – How likely is it that the supplier will go bankrupt?
These are the types of factors that highlight the quality of the company, including its management and practices. Understanding these things is vitally important if you want to avoid supply chain disruptions.
Procurement can support the company’s mission
LUPR can take you from “who are our top suppliers” to an in-depth understanding of “what are the potential risks of having these particular companies as our top suppliers”? Marrying traditional spend data to the supplier performance and risk data in LUPR enables you to explain:
Unsustainable Spend – What are we spending with suppliers that operate in an unsustainable way?
Spend at Risk – Which of our spend categories suffers the most from poorly-performing suppliers?
Diversity – How close are we to meeting our minority, veteran, or women-owned spending goals?
Use these deeper insights to change behaviors
In response to today’s big data world, many (but not all) procurement organizations have implemented spend analytics. Those that take things further than traditional spend analytics and go deeper than the “top-level” insights that this traditional approach provides will be the leaders in their fields. By integrating your quantitative spend data with qualitative data about your suppliers you can identify risks and take action to better align to your company’s strategies and head off problems before they derail your carefully laid plans..
To learn more about how you can see your spend in 4D, schedule a free meeting to discuss your team’s specific needs.